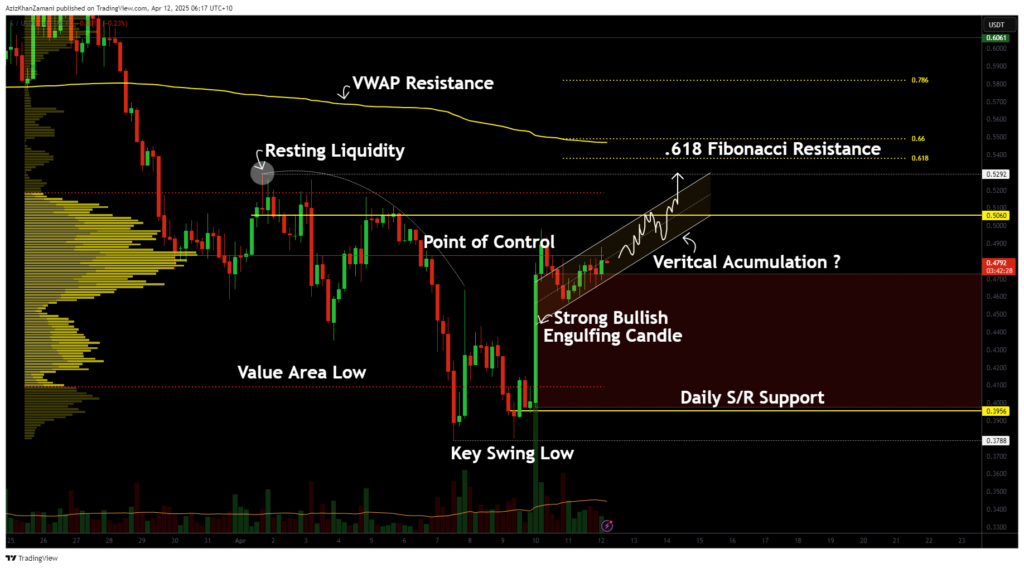
Sonic token has caught the eye of traders after a powerful bullish move from support. With price now consolidating under key resistance, the next breakout could be just around the corner—here’s what the chart is telling us.
Sonic (S) token has shown some serious momentum lately, catching the attention of traders with a powerful bullish engulfing candle. With price now grinding against key technical levels, the next few moves could be crucial in determining whether we see continuation—or signs of a reversal.
Key points:
- Strong bullish engulfing candle from the value area low and daily support at $0.39
- Price consolidating just under point of control, hinting at vertical accumulation
- $0.52 liquidity target aligns with 0.618 Fibonacci and VWAP resistance

The recent price action on Sonic Token has been notably impulsive, starting with a strong bullish engulfing candle that formed right at the value area low. This region also aligned perfectly with daily support around $0.39, giving the move significant technical weight.
The surge was accompanied by a rising volume profile, confirming buyer interest and demand at that level. Following the push, price now finds itself consolidating near the point of control—typically a sign that the market is building a base, not reversing.
Potential vertical accumulation
If Sonic continues to trade above the point of control, this could signal the presence of vertical accumulation. This kind of price action, characterized by higher lows on the lower time frame within a compact trading range, often leads to further bullish continuation.
One critical area to watch is the resting liquidity around $0.52. This level stands out as an untapped high and a magnet for price, especially with the 0.618 Fibonacci level and VWAP resistance stacked just above it.
Reaching that $0.52 region makes both technical and psychological sense. The theory of liquidity suggests that markets seek out areas of uncollected orders. Once price had taken the lower-side liquidity and bounced hard, the next logical move is to target the highs.
That target also lines up with the value area high of the current range, meaning a tap of that level would complete a full range rotation from low to high. If Sonic starts distributing around that resistance area, that could mark the start of a longer consolidation phase.
Right now, the chart is still showing signs of strength. There are no clear signals of weakness, and vertical accumulation patterns tend to continue until exhaustion. While it’s smart to be cautious near resistance, prematurely shorting Sonic without a clear rejection could be risky. For now, the bulls are in control—and the $0.52 target remains in play until proven otherwise.
